| |
Frontier Analyst 4.3 丨 数据包络分析软件培训 |
| |
 班级人数--热线:4008699035 手机:15921673576/13918613812( 微信同号) 班级人数--热线:4008699035 手机:15921673576/13918613812( 微信同号) |
| 增加互动环节,
保障培训效果,坚持小班授课,每个班级的人数限3到5人,超过限定人数,安排到下一期进行学习。 |
| 授课地点及时间 |
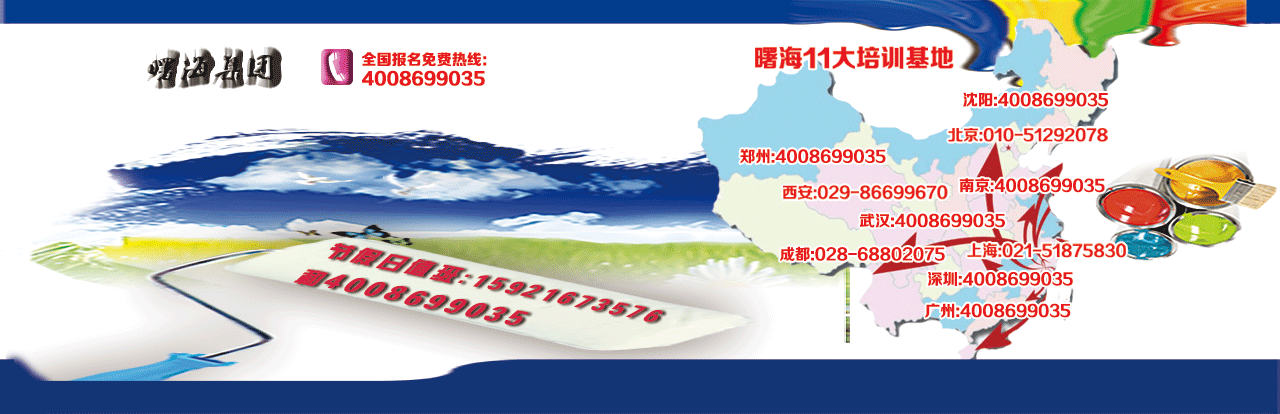
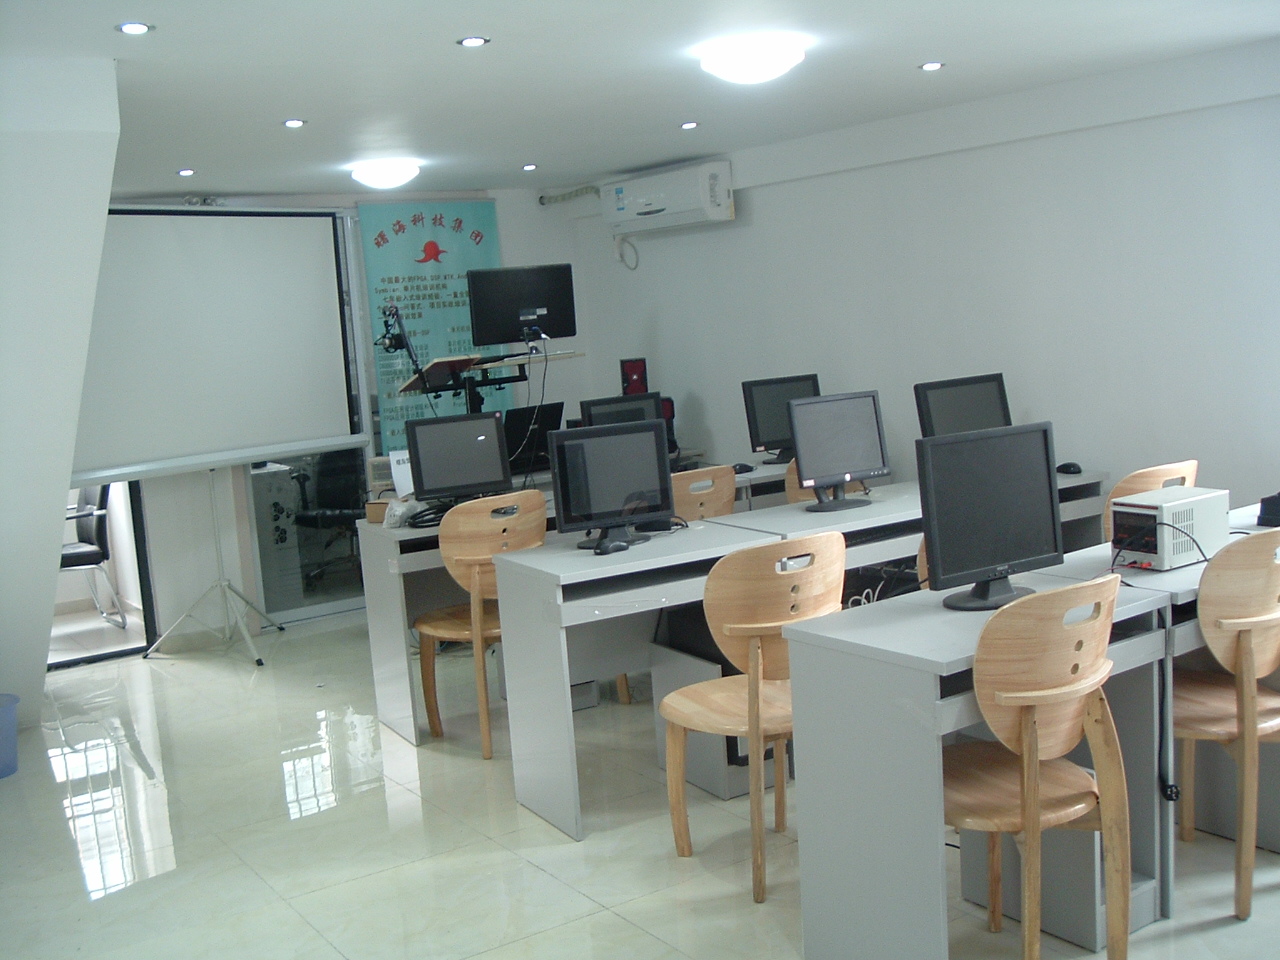
上课地点:【上海】:同济大学(沪西)/新城金郡商务楼(11号线白银路站) 【深圳分部】:电影大厦(地铁一号线大剧院站)/深圳大学成教院 【北京分部】:北京中山/福鑫大楼 【南京分部】:金港大厦(和燕路) 【武汉分部】:佳源大厦(高新二路) 【成都分部】:领馆区1号(中和大道) 【广州分部】:广粮大厦 【西安分部】:协同大厦 【沈阳分部】:沈阳理工大学/六宅臻品 【郑州分部】:郑州大学/锦华大厦 【石家庄分部】:河北科技大学/瑞景大厦
开班时间(连续班/晚班/周末班):2026年06月8日..推荐就业....实战、实操....从入门到精通....全国连锁..精准匹配专家..专家培训...用心服务.....良心教育....参加培训,提升专业技能....课程再次升级....学用相长,注重实践....以质量求发展....合作共赢....实用实战....用心服务......--即将开课--........................(欢迎您垂询,视教育质量为生命!) |
| 课时 |
◆资深工程师授课
☆注重质量
☆边讲边练
☆若学员成绩达到合格及以上水平,将获得免费推荐工作的机会
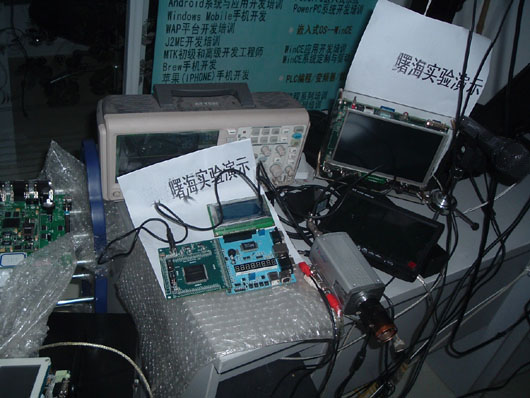
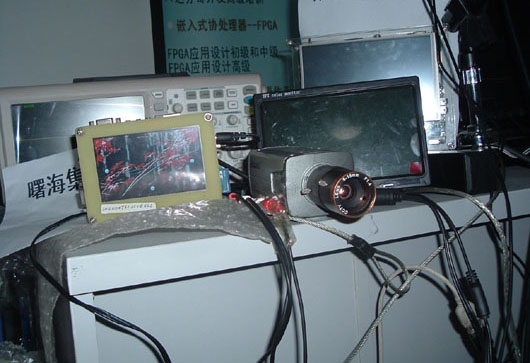
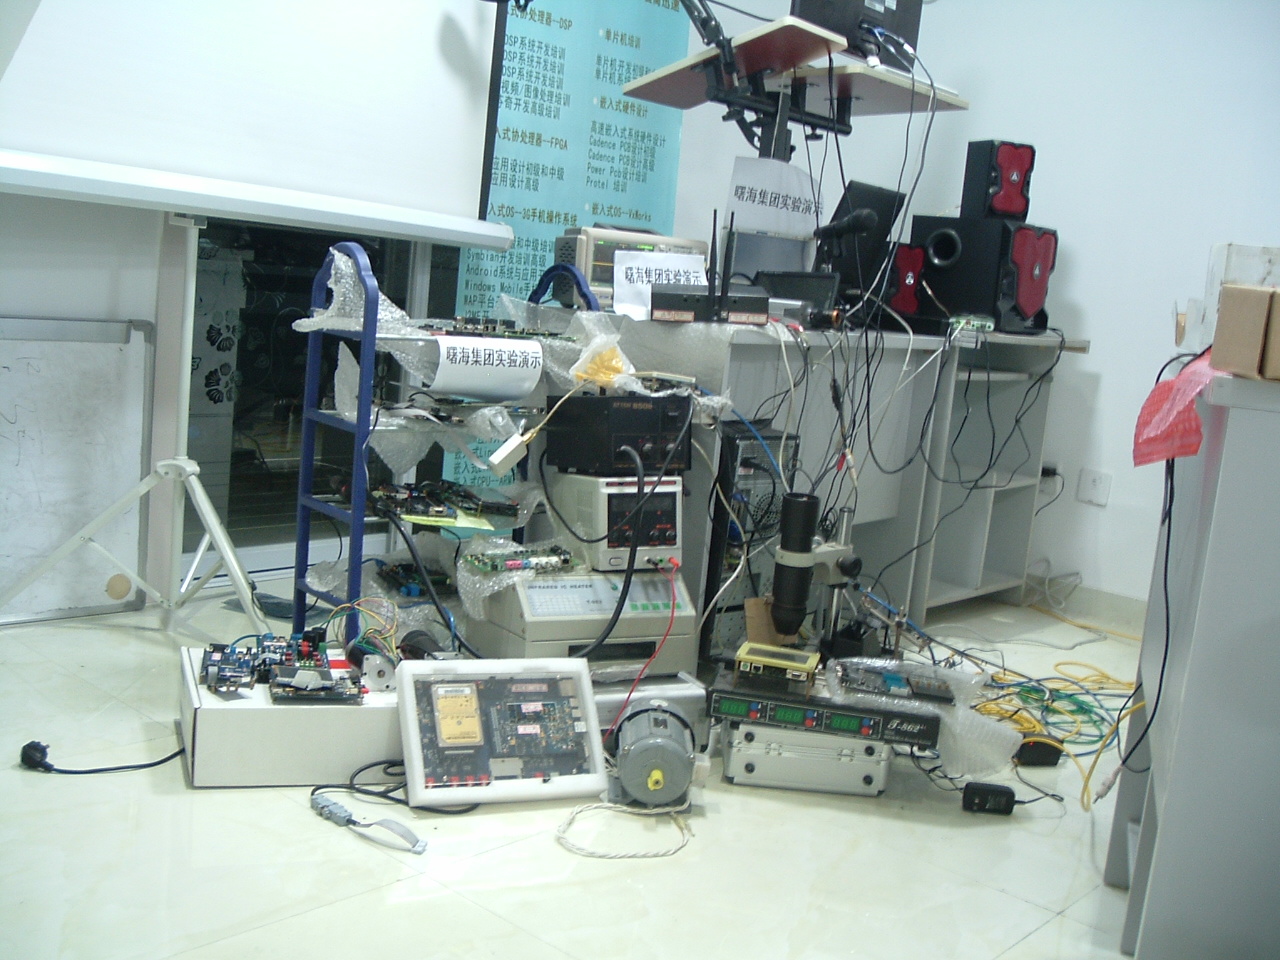
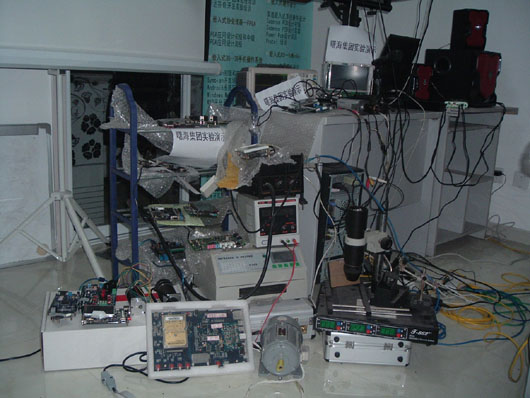
★查看实验设备详情,请点击此处★ |
| 质量以及保障 |
☆
1、如有部分内容理解不透或消化不好,可免费在以后培训班中重听;
☆ 2、在课程结束之后,授课老师会留给学员手机和E-mail,免费提供半年的课程技术支持,以便保证培训后的继续消化;
☆3、合格的学员可享受免费推荐就业机会。
☆4、合格学员免费颁发相关工程师等资格证书,提升您的职业资质。 |
☆课程大纲☆ |
| |
- ATLAS.ti是一个功能强大的工作台,用于对大量文本,图形,音频和视频数据进行定性分析。先进的工具可帮助您以创新,系统的方式安排,重新组装和管理您的材料。ATLAS.ti让您将注意力聚焦于资料本身。无论您的专业领域为人类学、经济学、刑事犯罪学或者医学∶ATLAS.ti都将满足您对数据定性分析的需要!
-
- ATLAS.ti的众多强项之一是它能处理种类极其繁多的媒体类型
-
- ATLAS.ti提供的工作媒体类型范围极其广泛。无论是对数以百计的音频片段或者成千的照片进行译码, ATLAS.ti都不会令您失望!
-
- ATLAS.ti可以处理绝大多数的常见文本、图像、音频和视频数据格式。多信息文本文件可能包含独特的格式、动态网页链接、以及内嵌式对象,诸如 Excel表格、 PowerPoint幻灯片、音频和视频片断。请您自由享受在多种文件格式下的工作,其中包括 20多种图像格式和许多音频格式(包括WAV, MP3, WMA),以及绝大多数的常用视频格式(包括 AVI, MPG, WMV)。
-
- ATLAS.ti工具和特性适用于您的复杂项目
-
- 您的 ATLAS.ti中心工作台是注释单元编辑器。请将它想象成您的项目集装箱。注释单元将所给项目的所有初始文件组织起来。初始文件再现您需要分析的文本、图像、音频和视频资料。
-
- 对所有基本项目元素的访问,诸如初始文件、引文、编码和备注,都非常迅速方便。用于增强控制的专用管理窗口可以在任何时候予以激活。译码过程可以简单地通过从编码管理器到所选数据片断的拖动来完成。
-
- 通过对象管理器、对象浏览器和同步浏览器浏览、驾驭您的项目数据。将您的阐述见解在一张电子地图中可视化,犹如自身遨游其中。
-
- 强大的工具集
- ATLAS.ti提供了一套功能强大且足够灵活的工具和功能,可以深入了解复杂的数据资料。
- ATLAS.ti中的中央工作区充当项目数据的容器。访问所有基本项目组件,例如文档,突出显示/编码数据段,代码,备忘录,超链接,组或网络,既快速又舒适。
- 只需将代码拖到选定的数据上即可完成编码。通过对象管理器,项目浏览器和共生资源管理器,您可以浏览项目数据。
-
- 以语义上有意义的方式链接您的发现。
-
- 随时随地在数字思维导图中显示您的发现和解释。
-
- 系统化的编码以及开发适用于您特定研究学科的系统
- 深度认识您的资料。通过网络编辑器、文本查找工具、自动编码器、对象爬行搜索器、高能文字计算器和查询工具探索您的数据。这些工具将帮助您发现您数据的质地纹理摄,以及其错综交织的含义。
-
- 独特的功能
- 该互动边缘区域是ATLAS.ti中一个独特的工作空间不被市场上的任何其他程序超越。它允许以独特直观的方式与您的数据进行交互,以数字方式传输数字世界中的传统纸笔类比。
-
- 强劲团队工作支持
- ATLAS.ti 以多种高效方式支持协同工作。通过一些专门工具(例如用户管理工具和注释单元合并器)以及应用软件的通用原则(对每个分析和生成的数据片断明确指派拥有人),协同工作轻而易举。超文本/XML生成器和 XSLT 转换器便于您将资料发布以及在线交互。所有这些新技术的工具(以及更多)帮助研究人员快速有效地工作。
-
- 主要功能:
- The next milestone in professional qualitative data analysis.
- ATLAS.ti is one of the most powerful tools for qualitative research. Managed documents, multi-document view, high-performance multimedia engine, intuitive margin-area coding for all data types, and much more.
-
- Multimedia
- ATLAS.ti offers state-of-the art multimedia processing. Frame-level and wave previews make coding audio and video material a joy; images can be fully coded in every detail and segments can even be moved and re-sized.
-
-
- Audio and Video documents
- When you add a video document to a project, preview images are created. Next to the preview images you see the audio wave form. By right-clicking on the video preview you can set a number of display options in the context menu.
-
-
-
- Zooming In
- Sliders appear when you move the mouse pointer over the full preview and let you select just the section of the video that you want to see in the margin area:
-
-
- Display of Audio files
- Audio files are displayed in a similar manner. Instead of the video image, you see a white background displaying the file name and the audio wave form. You can zoom in on the audio wave as needed:
-
-
- Multi-Docs
- You can open up to four documents side-by-side in the ATLAS.ti HU editor. This opens up fantastic possibilities for comparative work and makes work faster and more efficient all around.
-
- Work on Multiple Documents At The Same Time
- Documents can be dragged from the navigation pane or the P-Docs Manager onto the region button to open them.
-
-
- HU editor with two document regions
- Work on all open documents in their own margin-areas. All features and tools are available, so you can code, link, and annotate all as you would with a singe document.
-
- You can switch the margin area off if you simply want to compare documents. To change the position of the documents, drag & drop them into the desired region:
-
-
- Moving documents between regions
- Linking Across Documents
- The multi-document view makes it easy to link sections across various documents. Simply drag and drop a quotation between regions (1) to create what is called a hyperlink (3) in ATLAS.ti. The relation between the two data segments can be labeled (2), e.g. using a relation like supports, explains, contracts or discusses. You can chose amongst a number of predefined lables or create your own.
-
-
- Creating hyperlinks across regions
- Double-click on a hyperlink and a window pops up providing information on the linked quotation. Or use the short-cut Ctrl + double-click to immediately jump to the linked quotation. If the document containing the linked quotation is not currently loaded, it is loaded into the neighboring region and you can view the linked segments side-by-side.
-
-
- --------------------------------------------------------------------------------
- Analysis
- ATLAS.ti 7 is a powerful analytical tool. Its individual analysis options are centrally organized and designed for maximum efficiency, accuracy, and performance. Cloud views provide very quick, accurate, and yet intuitive analytical access to your data material. The query tool, ccooccurence explorer and the codes-PD-table allow in-depth analysis.
-
- Cloud Views for Codes and Documents
- The list of codes can be displayed in various cloud views. You can display the cloud based on number of code usage or on number of linkages to other codes. The order can be arranged alphabetically or by frequency.
-
- Code cloud view
- Document cloud views can present the entire textual database or can be used for single documents. Below is an example that compares cloud views of four newspaper articles reporting on the Pussy Riot verdict.
-
- The Query Tool
- Use the Query Tool to retrieve quotations using their associated codes. The simplest retrieval of this kind using the Code Manager is “search for quotations with codes.” Double-click on a code to retrieve all its quotations. This may be regarded as a query even if it is a simple one. The Query Tool can be used to create and process more complex queries that include combinations of codes.
-
- A query is a search expression built from operands (codes and code families) and operators (e.g. NOT, AND, OR, etc.) that define the conditions a quotation must meet to be retrieved (e.g., all quotations coded with both codes A and B).
-
- By selecting codes or code families and operators, a query can be built incrementally, instantaneously evaluated and displayed as a list of quotations. This incremental building of complex search queries gives you an exploratory approach for even the most complex queries.
-
-
- The Query Tool window
- The Query Tool has the following main components:
-
- [1] The operator toolbar offering 14 different operators (Boolean, semantic and proximity operators)
-
- [2 and 3] The list of code-families andcodes that can be used in queries.
-
- [4] The term-stack pane in the upper right displays the stack of all expressions entered in the current query.
-
- [5] The current query is displayed in the feedback pane.
-
- [6] A result of a query in the query tool is always a list of quotations. These are displayed in the results list. From there you can also access the quotations in context or create an output via the output (printer) button.
-
- Via the Scope button, code queries can be combined with variables. For example, you can ask questions like “Give me all quotations coded with positive attitude towards candidate XY from female respondents between the ages of 18 and 29.”
-
- Cooccurence Explorer
- The Cooccurrence Explorer allows you to see codes that co-occur across all or just some selected primary documents. The result is a cross-tabulation of codes. It is often meaningful to apply filters for certain codes and documents in order to concentrate on a more specific set of concepts. The side panels in the code and document manager allow you to quickly prepare the kind of filters you need in order to produce the kind of tables you want.
-
- As an example, below we look at one of the questions posed in the sample project. The aim is to find out how parents and non-parents respond to the question of “why or why not to have children.” In order to reduce the full set of codes, a code group (called code family in ATLAS.ti) was prepared so that it only contains the two attribute codes (#fam: has children and #fam: no children) plus all codes related to “reasons for having children” and “reasons for not having children”. This family is then set as filter.
-
- In the code-cooccurence table the next step is to select the attribute codes as columns and all content codes as rows.
-
- Selecting row and column codes
- This results in the following table, providing a quick overview of where the differences are.
-
- Settings: No color for table cell; use code color as header background
- By clicking on the cells, you can access the qualitative data content behind it.
-
- Accessing the qualitative information behind the numbers
- The Codes-Primary-Documents Table
- The Codes-PD-Table can provide an overview of code frequencies by documents, or can show code frequencies by document groups, code group frequencies by document, or document group.
-
- An example below is based on a sample data set. It is a comparison of statements about the positive or negative effect of parenting across different groups. For this purpose of this exercise, two code families have been created. They group all codes that mark statements into positive and negative effects of parenting. These are selected in the upper section. They are then displayed as rows in the table.
-
- The various groups for comparison are selected in the lower section of the tool.
-
- Setting options for the Codes-Primary-Documents-Table
-
- In the Excel table below, they are shown in the columns:
-
-
- Formatted Excel output of a codes-primary-documents-table
- The query tool allows to create document families based on the results of a code query. Thus, the next step is to go back to the query tool, enter a new query and save the results in the form of new document groups. That way you can iteratively run your next comparison using the Codes-PD-Table.
-
- Thus, all ATLAS.ti’s analysis tools can be used in complimentary combinations for different purposes.
-
- --------------------------------------------------------------------------------
- Visualization
- ATLAS.ti 7 is a highly visually-oriented tool. This includes everything from user interface (laid out to maximize convenience and screen real estate) to various Object Managers to the intelligent layout of Network Views. Everything is equally intuitive and efficient.
-
- Interface and Previews
- A powerful navigation pane can be opened on the left-hand side of the editor when needed:
-
- Accessing the navigation pane
- It can be used to access and search all object types from one place. This includes primary documents, codes, coded segments, memos and network views.
-
- Preview images for documents and network views in the navigation pane
- For primary document and network views, the view can be set to show preview images. The ability to see previews of your documents at any step makes your work much faster.
-
- This option is also available in the Primary Document and Network View Manager:
-
- Preview images for documents in Primary Doc Manager
- In addition to the views in the navigation pane, more information is provided for each document and network view. You can chose to display size – thumbnail image, large, extra large, jumbo and Godzilla (512×512).
-
- --------------------------------------------------------------------------------
- Visualizations In Object Managers
- The object managers do not just list objects. They also help you gain a quick visual overview in various ways. The primary document manager displayed below shows the list of documents on the right-hand side and the list of document groups (i.e. families) in the side panel on the left-hand side.
-
- Forms of visualization in the object managers
- The frequency bars show how many data segments have been coded in each document. When you select a document you immediately see which family it belongs to (highlighted family icon below).
-
- The same display options are available in the Code and Memo Manager.
-
- If you select an object group – which can be a document, code or memo family – the selected family icon changes its look and the background color turns pale yellow. Below, the document family “Gender: female” is set as the global filter in the above example and so the list on the right-hand side only displays the documents of female respondents:
-
- --------------------------------------------------------------------------------
- Network Views
- The network view helps represent complex information by showing it in an intuitively accessible graphic means. This more closely resembles the way human memories and thoughts are structured. Cognitive “load” in handling complex relationships is reduced with the aid of spatial representation techniques. ATLAS.ti uses networks to help represent and explore conceptual structures. Networks add a heuristic “right brain” approach to qualitative analysis.
-
- The user can manipulate and display almost all objects within an ATLAS.ti project as nodes in a network view. This includes quotations, codes, code families, memos, memo families, other network views, primary documents (PDs), and PD families.
-
- Network view displaying different types of objects and relations
- Links are created either implicitly (i.e. when coding a quotation, the quotation is “linked” to a code) or explicitly by the user. Code-quotation associations also form a network that can be displayed like any other:
-
- Code-quotations links
-
- Examples of directed and non-directed links
- The links between two codes and the links between two quotations can be named. In addition, you can select whether a link should be directed or non-directed.
-
- Along with using networks for general “mind mapping” and the visual design of theoretical models, network views also serve as a powerful analytical tool. Using networks for retrieval purposes is a well-known technique in information retrieval.
-
- Finally, network views can be exported as graphic files and inserted into other applications. Or you can simply copy and paste them directly into MS Word and PowerPoint files.
-
- --------------------------------------------------------------------------------
-
- Print with Margin
- The Print with Margin options shows the coded document as you see it on screen. It is available for all text documents, PDF and image files.
-
- --------------------------------------------------------------------------------
- PDF
- ATLAS.ti’s full-native PDF support lets you work with PDF files in their native layout, in just the way you have come expect. No ifs, ands, or buts.
-
- ATLAS.ti treats your PDF documents exactly like Acrobat Reader. Work as smoothly and flexibly as you would in Acrobat, utilize bookmarks, tables of content, scrolling, and flexible page views. Code to your heart’s delight – text, images, or anything else that is on the page, down to whatever level of detail you need. Annotate, comment, link, search and query, visualize your results – it’s what computer-based data analysis was always meant to be.
-
- Other QDA packages make you strip PDFs down to primitive text files. That is hardly an adequate way of working. Starting with ATLAS.ti 6, you have been able to keep your original PDFs untouched—layout, graphics, tables and all. That way your primary data always remains uncorrupted and complete.
-
-
- Coding PDF documents
- Working with PDFs in the manner allows you to move freely through your documents and code any section you like, regardless of whether it is text or graphics. Smooth scrolling, zooming, searching and auto-coding makes your work a breeze. Navigation tools and thumbnail images keep you “on track” every step of the way.
-
- Consider the enormous possibilities:
- ◦Work on Web pages saved to PDF. Securely maintain the original layout, graphics, and, most importantly, all the actual content at the time of visiting.
- ◦Directly access a plethora of publicly available resources like research papers, business reports, conference proceedings, press releases, and much more. Now it’s all at your fingertips – without conversion or additional steps of any kind.
- ◦Last but not least, use output from practically ANY computer application as a primary document. By creating a PDF document (via a simple printer driver) you can now directly use material created in nearly any program, including PowerPoint, Open Office, ATLAS.ti itself as well as graphics, statistics, reporting, authoring, accounting and all sorts of business software as your primary documents.
- The possibilities are truly endless and extremely exciting!
-
- --------------------------------------------------------------------------------
- GeoData
- One of the most exciting software features – and one that is likely to change the way you work if you haven’t used it yet – is ATLAS.ti’s geo-coding support.
-
- ATLAS.ti embeds Google Earth™ and makes its functionality available inside the program. This has immense benefits and opens up fantastic possibilities for your work.
-
- Picture, if you will, the world as your ultimate primary document. Freely move around in it and mark any section that interests you. Then treat that segment exactly the way you would any other document in ATLAS.ti. Code it, comment it, and link it to other objects. Use direct hyperlinks from other primary documents for supporting your arguments and for purposes of evidence or illustration.
-
- The geo-coding facility even creates screenshots from any Google Earth™ view and assigns them as graphical primary documents. This “snapshot” helps you save system resources and makes sure that your reference is secure against changes.
-
- All features of Google Earth™ are available (including camera angle and height-over-ground). Additionally, the interaction between the two programs is truly bi-directional. This means that work done in ATLAS.ti can be directly introduced into Google Earth™. Comment on a marked location in ATLAS.ti, and your comment will be displayed in Google Earth™. Powerful stuff!
-
- And that’s still not all. Leverage the immense power of community as embodied by Google Earth™ layers and by the possibility to exchange and directly import Google Earth™’s KMZ files (complex community-created “overlays”). If it weren’t so tacky we’d call it “QDA 2.0.”
-
- If your work is in or touches on fields like tourism, geography, urban planning, ethnology, cultural studies, sociology, health, action research, advertising and marketing – or even if you simply like to take and document trips – you are bound to profit from ATLAS.ti’s unique geo-coding feature. Just like us, you will soon wonder how you used to go without this feature.
-
- --------------------------------------------------------------------------------
- Surveys
- Imagine converting the results of a large online survey into a Hermeneutic Unit in ATLAS.ti with just a few mouse clicks. ATLAS.ti lets you do just that!
-
- Here is a typical work flow:
-
- 1.Create an online survey using, for example, Google Docs (a very convenient tool, although other frameworks are supported as well)
- 2.Download and store the survey as an Excel table once your respondents have filled out the questionnaire
- 3.Import the table into ATLAS.ti
- 4.Voilà: Each row (= one respondent) becomes a primary document, and content is collected and created from the answers to open-ended questions. PD families are created from single and multiple-choice questions; quotations are created for each answer and coded with the respective question (you may use abbreviations). This accomplishes a lot of tedious pre-coding work in a few seconds.
- Now you can get started with what really matters: Your analysis!
-
- It’s that easy to work with survey data from nearly any source.
|
|
|
|
 合作伙伴与授权机构 合作伙伴与授权机构 |

Altera全球合作培训机构
|
诺基亚Symbian公司授权培训中心 |

Atmel公司全球战略合作伙伴
|
微软全球嵌入式培训合作伙伴 |

英国ARM公司授权培训中心 |

ARM工具关键合作单位 |
|
|
|
| 我们培训过的企业客户评价: |
曙海的andriod 系统与应用培训完全符合了我公司的要求,达到了我公司培训的目的。
特别值得一提的是授课讲师针对我们公司的开发的项目专门提供了一些很好程序的源代码, 基本满足了我们的项目要求。
——上海贝尔,李工
曙海培训DSP2000的老师,上课思路清晰,口齿清楚,由浅入深,重点突出,培训效果是不错的,
达到了我们想要的效果,希望继续合作下去。
——中国电子科技集团技术部主任 马工
曙海的FPGA 培训很好地填补了高校FPGA培训空白,不错。总之,有利于学生的发展,
有利于教师的发展,有利于课程的发展,有利于社会的发展。
——上海电子,冯老师
曙海给我们公司提供的Dsp6000培训,符合我们项目的开发要求,解决了很多困惑我
们很久的问题,与曙海的合作非常愉快。
——公安部第三研究所,项目部负责人李先生
MTK培训-我在网上找了很久,就是找不到。在曙海居然有MTK驱动的培训,老师经验
很丰富,知识面很广。下一个还想培训IPHONE苹果手机。跟他们合作很愉快,老师很有人情味,态度很和蔼。
——台湾双扬科技,研发处经理,杨先生
曙海对我们公司的iPhone培训,实验项目很多,确实学到了东西。受益无穷
啊!特别是对于那种正在开发项目的,确实是物超所值。
——台湾欧泽科技,张工
通过参加Symbian培训,再做Symbian相关的项目感觉更加得心应手了,理
论加实践的授课方式,很有针对性,非常的适合我们。学完之后,很轻松的就完成了我们的项目。
——IBM公司,沈经理
有曙海这样的DSP开发培训单位,是教育行业的财富,听了他们的课,茅塞顿开。
——上海医疗器械高等学校,罗老师
|
| 我们新培训过的企业客户以及培训的主要内容: |
| |
一汽海马汽车 DSP培训
苏州金属研究院 DSP培训
南京南瑞集团技术 FPGA培训
西安爱生技术集团 FPGA培训,DSP培训
成都熊谷加世电气 DSP培训
福斯赛诺分析仪器(苏州) FPGA培训
南京国电工程 FPGA培训
北京环境特性研究所 达芬奇培训
中国科微系统与信息技术研究所 FPGA高级培训
重庆网视只能流技术开发 达芬奇培训
无锡力芯微电子股份 IC电磁兼容
河北科研究所 FPGA培训
上海微小卫星工程中心 DSP培训
广州航天航空 POWERPC培训
桂林航天工 DSP培训
江苏五维电子科技 达芬奇培训
无锡步进电机自动控制技术 DSP培训
江门市安利电源工程 DSP培训
长江力伟股份 CADENCE 培训
爱普生科技(无锡 ) 数字模拟电路
河南平高 电气 DSP培训
中国航天员科研训练中心 A/D仿真
常州易控汽车电子 WINDOWS驱动培训
南通大学 DSP培训
上海集成电路研发中心 达芬奇培训
北京瑞志合众科技 WINDOWS驱动培训
江苏金智科技股份 FPGA高级培训
中国重工第710研究所 FPGA高级培训
芜湖伯特利汽车安全系统 DSP培训
厦门中智能软件技术 Android培训
上海科慢车辆部件系统EMC培训
中国电子科技集团第五十研究所,软件无线电培训
苏州浩克系统科技 FPGA培训
上海申达自动防范系统 FPGA培训
四川长虹佳华信息 MTK培训
公安部第三研究所--FPGA初中高技术开发培训以及DSP达芬奇芯片视频、图像处理技术培训
上海电子信息职业技术--FPGA高级开发技术培训
上海点逸网络科技有限公司--3G手机ANDROID应用和系统开发技术培训
格科微电子有限公司--MTK应用(MMI)和驱动开发技术培训
南昌航空大学--fpga 高级开发技术培训
IBM 公司--3G手机ANDROID系统和应用技术开发培训
上海贝尔--3G手机ANDROID系统和应用技术开发培训
中国双飞--Vxworks 应用和BSP开发技术培训
|
上海水务建设工程有限公司--Alter/Xilinx FPGA应用开发技术培训
恩法半导体科技--Allegro Candence PCB 仿真和信号完整性技术培训
中国计量--3G手机ANDROID应用和系统开发技术培训
冠捷科技--FPGA芯片设计技术培训
芬尼克兹节能设备--FPGA高级技术开发培训
川奇光电--3G手机ANDROID系统和应用技术开发培训
东华大学--Dsp6000系统开发技术培训
上海理工大学--FPGA高级开发技术培训
同济大学--Dsp6000图像/视频处理技术培训
上海医疗器械高等专科学校--Dsp6000图像/视频处理技术培训
中航工业无线电电子研究所--Vxworks 应用和BSP开发技术培训
北京交通大学--Powerpc开发技术培训
浙江理工大学--Dsp6000图像/视频处理技术培训
台湾双阳科技股份有限公司--MTK应用(MMI)和驱动开发技术培训
滚石移动--MTK应用(MMI)和驱动开发技术培训
冠捷半导体--Linux系统开发技术培训
奥波--CortexM3+uC/OS开发技术培训
迅时通信--WinCE应用与驱动开发技术培训
海鹰医疗电子系统--DSP6000图像处理技术培训
博耀科技--Linux系统开发技术培训
华路时代信息技术--VxWorks BSP开发技术培训
台湾欧泽科技--iPhone开发技术培训
宝康电子--Allegro Candence PCB 仿真和信号完整性技术培训
上海天能电子有限公司--Allegro Candence PCB 仿真和信号完整性技术培训
上海亨通光电科技有限公司--andriod应用和系统移植技术培训
上海智搜文化传播有限公司--Symbian开发培训
先先信息科技有限公司--brew 手机开发技术培训
鼎捷集团--MTK应用(MMI)和驱动开发技术培训
傲然科技--MTK应用(MMI)和驱动开发技术培训
中软国际--Linux系统开发技术培训
龙旗控股集团--MTK应用(MMI)和驱动开发技术培训
研祥智能股份有限公司--MTK应用(MMI)和驱动开发技术培训
罗氏诊断--Linux应用开发技术培训
西东控制集团--DSP2000应用技术及DSP2000在光伏并网发电中的应用与开发
科大讯飞--MTK应用(MMI)和驱动开发技术培训
东北农业大学--IPHONE 苹果应用开发技术培训
中国电子科技集团--Dsp2000系统和应用开发技术培训
中国船舶重工集团--Dsp2000系统开发技术培训
晶方半导体--FPGA初中高技术培训
肯特智能仪器有限公司--FPGA初中高技术培训
哈尔滨大学--IPHONE 苹果应用开发技术培训
昆明电器科学研究所--Dsp2000系统开发技术
奇瑞汽车股份--单片机应用开发技术培训
|
|
|
|
|


 shuhaipeixun
 1299983702
 总部李老师
总部李老师